Is it worth switching your VMware vSphere VM’s SCSI (small computer system interface) from the LSI Logic Parallel controller to the VMware Paravirtual SCSI controller? Except for ultra-high-end database servers (> 1M IOPS ( input/output operations per second)), the answer is “no”; the difference is negligible.
Our benchmarks show that VMware’s Paravirtual SCSI (small computer system interface) controller offered a 2-3% performance increase in IOPS (I/O (input/output) operations per second) over the LSI Logic Parallel SCSI controller at the cost of a similar decrease in sequential performance (both read & write). Additionally the Paravirtual SCSI controller (pvscsi) had a slight reduction in CPU (central processing unit) usage on the host (best-case scenario is 3% lower CPU usage).
The Benchmarks
The Paravirtual has better IOPS than the LSI Logic, but worse sequential throughput.
On average the Paravirtual Driver’s (red) IOPS performance is 2.5% better than the LSI Logic’s
Although not consistently faster, the LSI Logic averages 2% faster than the Paravirtual on sequential read operations
The LSI Logic’s sequential write performance is consistently faster than the Paravirtual’s by an average of 4%
Host CPU Utilization
The ESXi host CPU utilization was trickier to measure—we had to eyeball it. You can see the two charts below, taken while we were running our benchmarks. Our guess is that the Paravirtual driver used ~3% less CPU than the LSI Logic.
Note that 3% is a best-case scenario (you’re unlikely to get 10% improvement): the benchmarks were taken on what we affectionately refer to as “The world’s slowest Xeon”, i.e. the Intel Xeon D-1537, which clocks in at an anemic 1.7GHz (side note: We purchased it for its low TDP (Thermal Design Power), not its speed). In other words, this processor is so slow that any improvement in CPU efficiency is readily apparent.


Benchmark Setup
We paired a slow CPU with a fast disk:
- Samsung SSD 960 2TB M.2 2280 PRO
- Supermicro X10SDV-8C-TLN4F+ motherboard with a soldered-on 1.7 GHz 8-core Intel Xeon Processor D-1537, and 128 GiB RAM.
We used gobonniego to benchmark the performance.
We ran each benchmark for 1 hour.
We configured the VMs with 4 vCPUs, 1 GiB RAM and a 20 GiB drive. We used 4 CPUs so that the Xeon’s slow speed wouldn’t handicap the benchmark results (we wanted the disk to be the bottleneck, not the CPU).
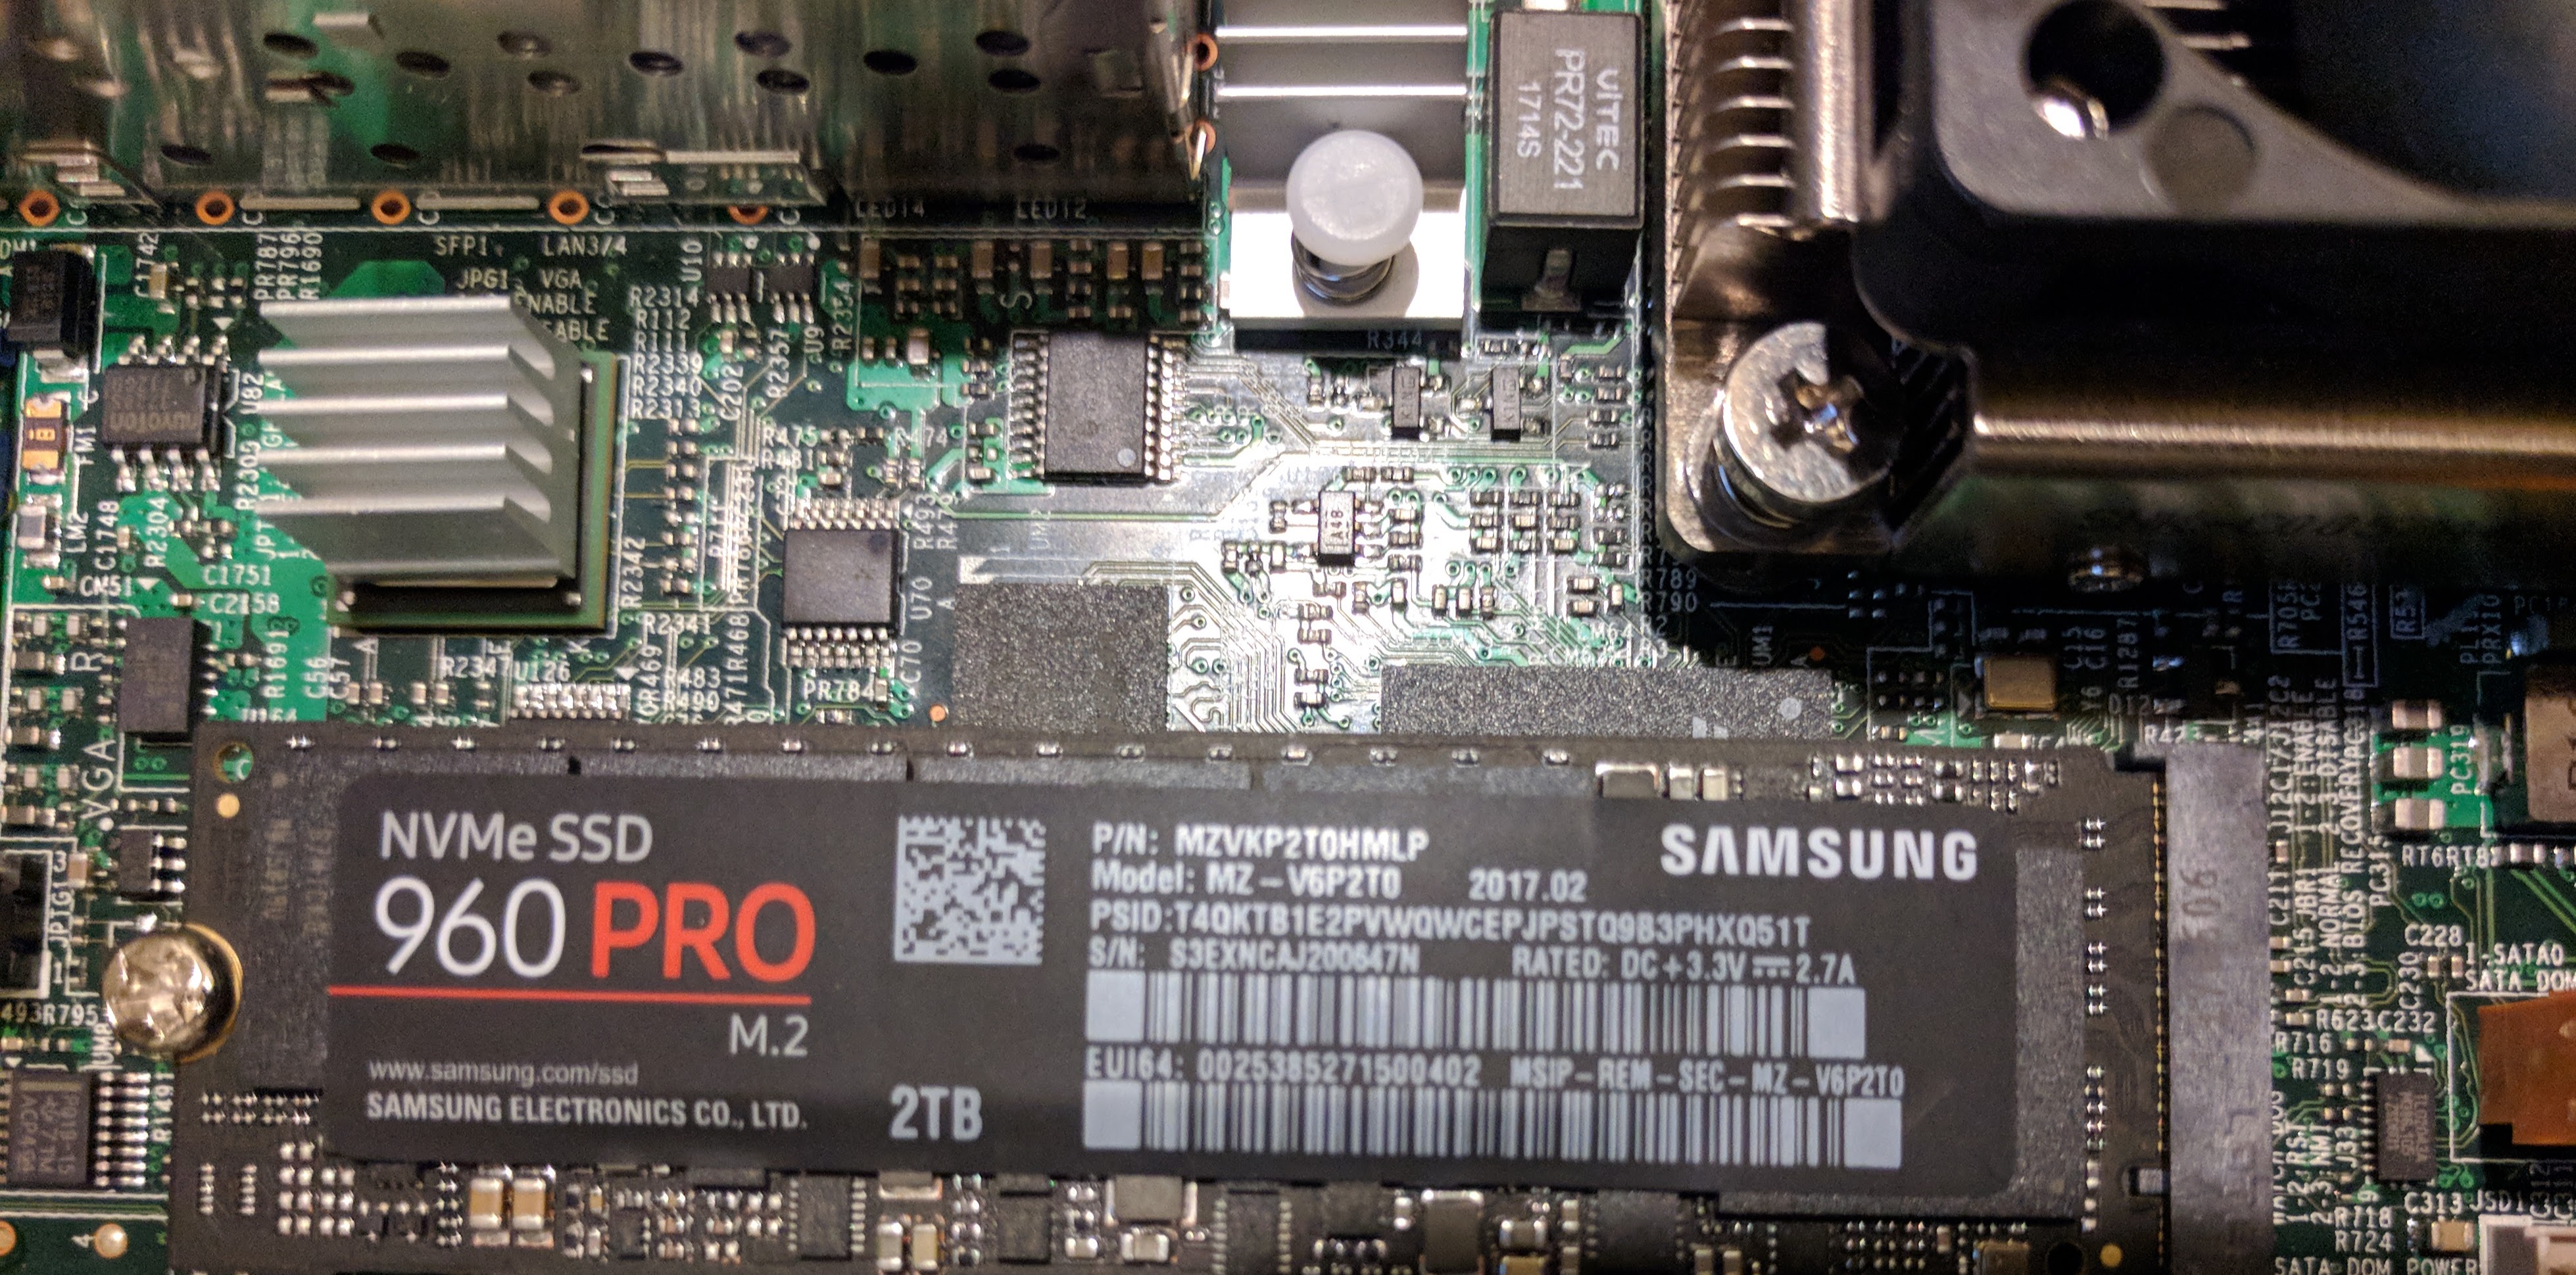
The Samsung NVMe SSD 960 Pro is a gold standard for NVMe disk performance.
Why These Benchmarks Are Flawed
In the spirit of full disclosure, we’d like to point out the shortcomings of our benchmarks:
We only tested one type of datastore. We tested an NVMe (non-volatile memory express) datastore, but it would have been interesting to test VMware’s vSAN (virtual storage area network).
We only ran the benchmark for an hour. Had we run the benchmark longer, we would have seen different performance curves. For example, when we ran the benchmarks back-to-back we saw degradation of the throughput from almost 2 GB/s to slightly more than 1 GB/s on the sequential read & write tests. We attribute this degradation to saturation of the Samsung controller.
We never modified the kernel settings to enhance pvscsi performance. For example, went with the default settings for queue depth for device (64) and adapter (254), but this VMware knowledgebase (KB) article suggests increasing those to 254 and 1024, respectively.
We only tested Linux. Windows performance may be different.
We benchmarked slightly different versions of Linux. We tested against two very-close versions of Ubuntu Bionic, but they weren’t the exact same version. Had we used completely identical versions, we may have seen different performance numbers.
References
Which vSCSI controller should I choose for performance?, Mark Achetemichuk, “PVSCSI and LSI Logic Parallel/SAS are essentially the same when it comes to overall performance capability [for customers not producing 1 million IOPS]”
Achieving a Million I/O Operations per Second from a Single VMware vSphere® 5.0 Host, “a PVSCSI adapter provides 8% better throughput at 10% lower CPU cost”. Our benchmarks show 2.5%, 3% respectively.
Large-scale workloads with intensive I/O patterns might require queue depths significantly greater than Paravirtual SCSI default values (2053145), “… increase PVSCSI queue depths to 254 (for device) and 1024 (for adapter)”
Raw Benchmark results (JSON-formatted).